
Before you pack your bags for an epic cross-country road trip, you’ll want to be sure to pack an extra dose of patience and defensive driving skills, too. We’re not saying to avoid these areas, but you should be aware of where the ten states in the U.S. with the worst driving records are.
Ranking the Worst of the Worst

How were the states ranked, you ask? SmartAsset considers three key metrics: the ratio of insured drivers, the frequency of DUI arrests per 1,000 drivers, and the number of fatalities per 100,000 miles driven. Here are the contenders for the dubious distinction of America’s worst driving.
#1 Mississippi

Reigning unchallenged at the top for three consecutive years is Mississippi. With just 76.3% of its drivers insured and a disturbing fatality rate of 1.63 per 100 million vehicle miles, it’s no wonder this state maintains its unenviable position.
#2 Nevada

Grabbing the second spot is Nevada, notorious for its high DUI incidence rate of 5.54 per 1,000 drivers. It also curiously leads the pack in online searches for traffic ticket-related issues.
#3 Tennessee

Taking the bronze in this unwelcome contest is Tennessee, another southern state, where only 80% of drivers are insured. However, it seems they’re attempting to clean up their act with a slight drop in DUIs from the previous year.
#4 Florida
Making it a southern trifecta, Florida lands in the fourth spot. With the dubious distinction of the lowest insured driver ratio at 73.3% and the 11th highest fatality rate, it’s a cautionary tale for motorists. Sadly, Florida holds three of the top five spots for worst cities in the U.S. for drivers. Use extra caution when driving in Jacksonville, Orlando, and Tampa.
#5 California
The Golden State doesn’t shine so brightly on the roadways, sitting in fifth place. Despite a relatively high insured driver ratio of 84.8%, California’s increasing DUI rate places it firmly on our list.
#6 Arizona

Cruising into the sixth spot is Arizona, which despite having 88.0% of its drivers insured, suffers from a high fatality rate of 1.53 per 100 million miles traveled.
#7 South Carolina

Occupying the seventh place is South Carolina, boasting an impressive insured driver ratio of over 90%. However, it’s the highest fatality rate in the top ten that casts a dark cloud over this otherwise impressive stat.
#7 Texas
Tying for seventh place is Texas. Although Texas does have a higher percentage of insured drivers at 85.9%, an unfortunate increase in DUI incidents puts the state on this list.
#9 New Mexico

Coming in ninth is New Mexico, where over a fifth of drivers are uninsured, and the state ranks 10th for fatalities per 100 million miles driven.
#10 Alaska
Last but not least is Alaska. With an uninsured driver rate of 84.6% and a worrying number of DUIs, it’s a frosty finish for Alaska on our list.
Here’s What It Was Really Like to Drive a Model T Ford
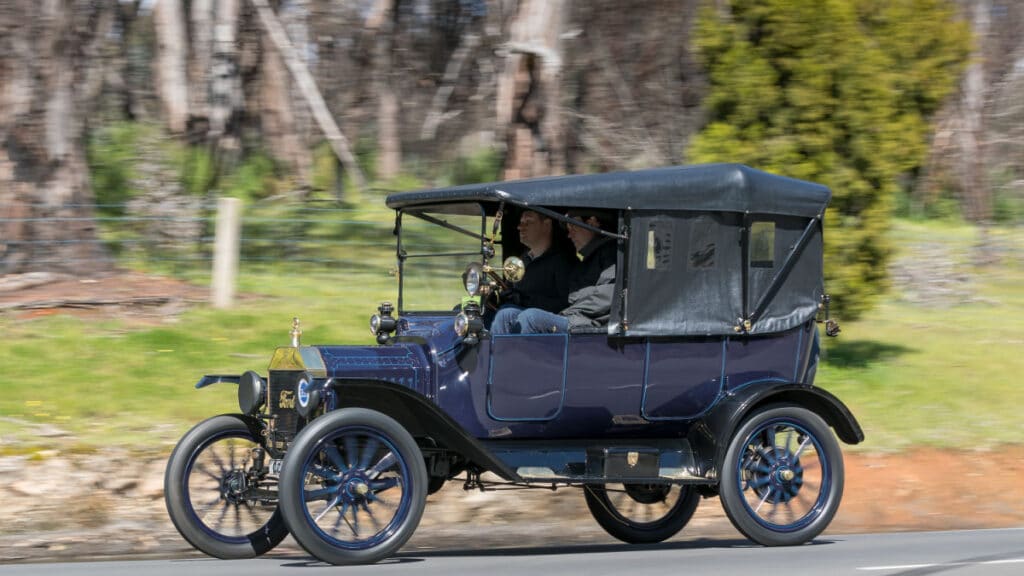
Tired of driving down easy-street in your super comfy modern car? Well, have no fear because the Model T is here! Let’s take a ride down memory lane with a humorous look at what traveling in a Model T was like when it first came out.
Here’s What It Was Really Like to Drive a Model T Ford
10 of the Most Dangerous Countries for Women Traveling Solo

Sadly, there are still places where female travelers face a heightened risk of violence and harassment. As a result, it’s more important than ever to prioritize the safety of women on the road. To help you plan your next adventure with confidence, we’ve compiled a list of the top 10 most dangerous countries for solo female travelers to avoid.
10 of the Most Dangerous Countries for Women Traveling Solo
7 Most Dangerous Countries to Travel With Your Kids Today

If planning a family trip abroad, be wary of traveling to countries with high tourist safety risks.
7 Most Dangerous Countries to Travel With Your Kids Today
Most Dangerous Jobs in America, Ranked

Uncover the sobering truth behind the top 10 most hazardous jobs, where courageous individuals face danger every day in order to keep the very fabric of American society from unraveling. The fatality rates presented in this article are based on the number of deaths per 100,000 full-time employees, assuming a standard work schedule of 40 hours per week and 50 weeks per year.
Most Dangerous Jobs in America, Ranked
Here’s What Travel Was Like 100 Years Ago

Travel has definitely improved over the past 100 years. And by the way, if you’re thinking 100 years ago was back in the 1800s, you might be showing your age…100 years ago was 1923 and Americans were hitting the road in their new-fangled automobiles. Here are ten things you might expect if you traveled across America 100 years ago.
Here’s What Travel Was Like 100 Years Ago
Statistics for ranking the ten U.S. cities with the worst driving records are provided by a report by the World Population Review.
This article was produced by Our Woven Journey. Featured Image Credit: Roman Samborskyi/Shutterstock.
Karee Blunt is a nationally syndicated travel journalist, focused on discovering destinations and experiences that captivate and inspire others through her writing. She is also the founder of Our Woven Journey, a travel site focused on inspiring others to create memory-making adventures with their loved ones. Karee is passionate about encouraging others to step out of their comfort zone and live the life they dream of. She is the mother of six kids, including four through adoption, and lives with her family in the Pacific Northwest. You can learn more about Karee on her about me page.